NRF 2019: Chick-fil-A and The Home Depot Make the Most of Data with Visualization
When you think of companies that are innovating with data analytics, Uber, Airbnb, Google and Facebook might come to mind. But nearly every industry has begun reaping the benefits of data analytics.
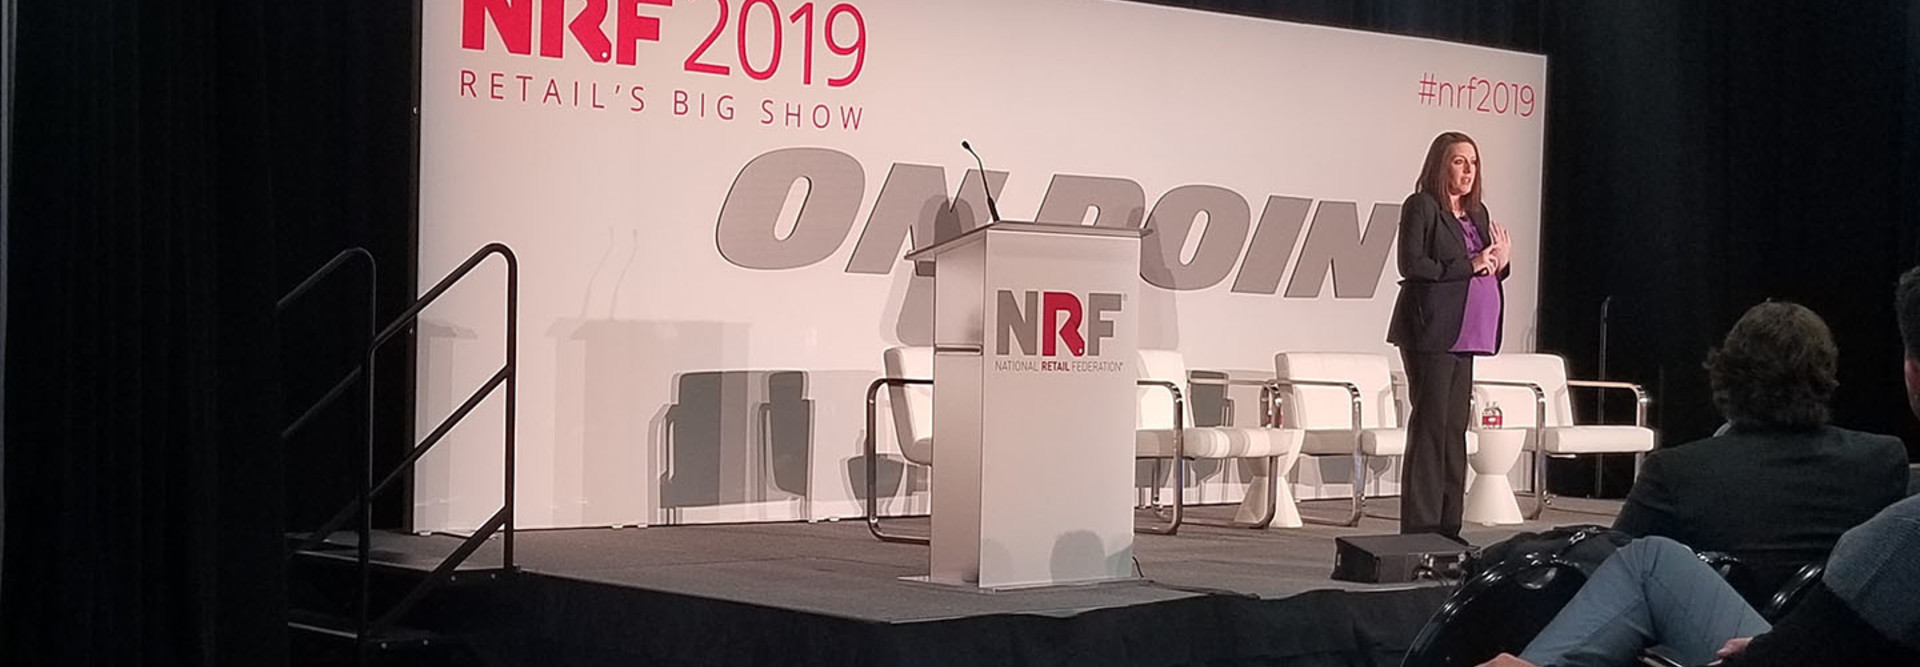
In a session at the National Retail Federation’s 2019 Big Show, taking place in New York City from Jan. 13-15, Karen Hinson, lead analyst with Chick-fil-A, credited a rise in efficiency across the organization to the use of data analytics.
JOIN THE CONVERSATION: Follow @BizTechMagazine on Twitter for continued NRF 2019 coverage.
“In a world where everyone has access to the same data, it balances power. But in the real world, one business often has more or superior information than another, and whenever that happens, the scales are tipped in their favor,” said Hinson, adding that companies that figure out how to leverage data to make better, faster decisions have a major advantage in the marketplace.
Fast Food Gets More Efficient with Analytics
Chick-fil-A is a quick-service restaurant chain based in Atlanta, with 2,000 locations across the country.
“Even fast-food chains can leverage data to get ahead,” said Hinson, noting that her brand isn’t the only in the industry to do this. Burger King took advantage of analytics with the launch of their new app by tapping geolocation data from users’ phones and sending coupons to customers that offered Whoppers for a penny if they were within 600 feet of a McDonalds.
Chick-fil-A Puts Data Visualization Dashboards to Work
Chick-fil-A has been using data and performance reporting to get ahead since 1999, when the data team created reporting documents manually, using Microsoft Access and Excel, that included financial information for every restaurant, region and the company as a whole. At the time, “this was a game changer,” said Hinson.
Eventually, however, this type of reporting, though valuable, became cumbersome. “It would take at least a full day of work every month,” said Hinson, adding that while the reports were data rich, they lacked analytics that could necessarily make that data useful.
This inefficiency extended to annual reports as well, which took more than a month to create and were expensive and inefficient to produce.
The answer to the brand’s data woes was Tableau, an analytics dashboard that automates the steps needed to generate reports and update dashboards to get information into the hands of those who need it, whenever they need it, said Hinson.
“Users can filter data quickly and customize the data so that they see exactly the data they are interested in, every time they log in,” said Hinson, noting that the new dashboards are available to all staff and pull several new dimensions of data.
“This has become the most popular dashboard on our server,” said Hinson. “It’s kept up to date automatically … It not only provides useful information to help us keep a pulse on the business, but the data is presented in a way that the users find engaging.”
Further, using Tableau, Chick-fil-A can build their annual report themselves in a fraction of the time it used to take. “It looks just the same as the old annual report, but not only does it send the report to executives as a PDF, it also allows them to log in to the data so they can play with it,” said Hinson.
Moreover, this data is already at work in Chick-fil-A locations. After the stores began to see long lines during busy periods, a staffer put together a dashboard of product-based data that the company used to better organize its store rooms and stock better for rush periods.
“Stores now have exactly what they need, when they need it,” said Hinson, noting that the new organizational system cuts down customer wait time.
The Home Depot Unveils Answers for Blinds.com with Analytics
Fast-food companies aren’t the only ones that can benefit from better data visualization. The Home Depot has also seen a major boost to its organization since adopting the Tableau dashboard for its recent acquisition of Blinds.com.
To help cut down on friction and better understand blind spots in its process, The Home Depot built out a robust self-serve Tableau environment for its data. This allowed the company to visualize its current environment, as well as move forward with predictive analytics that could help to prevent problems in the future.
In particular, the company was seeing remakes — the need to remake a product that had shipped to the customer either damaged or with the incorrect dimensions — eat into its top-line revenue, and wanted to find a way to better understand and prevent this from happening.
“Remakes can cost upward of 6 percent of top-line revenue. So anything we can do to prevent that from happening is powerful for the business,” said Chase Zieman, director of analytics and data science for Global Custom Commerce, an innovation hub within The Home Depot, during a separate session at NRF 2019.
Overall, Zieman credits the technology with saving more than $1 million in sales costs in 2018, and with building better insights with vendors who otherwise wouldn’t have access to the data available via Tableau.
“This is really powerful for our organization, to really combat some of our remake costs as well as for forecasting for future sales. Due to the fact that some of the categories are seasonal, being able to forecast sales today is really powerful for our clients,” said Zieman.
Keep this page bookmarked for articles from the event. Follow us on Twitter at @BizTechMagazine, or the official conference Twitter account, @NRFBigShow, and join the conversation using the hashtag #NRF2019.


