Aug 15 2025
Data Analytics

How Advanced Data Analytics Drives Decision-Making in Financial Services

Companies are gaining key insights from AI-driven solutions.

Most people regard bank runs as a thing of the Depression-era past, but in 2023, several U.S. financial institutions failed when they experienced unexpected runs on deposits. Taking notice, leaders at United Federal Credit Union, headquartered in St. Joseph, Mich., considered how it would respond to such an incident.

To get the answer, they turned to their Deposit Flow Tracker dashboard, which is part of their Qlik data analytics solution, to investigate how deposits were moving throughout the organization. The application allows users to reload data anytime to see if deposits are increasing or decreasing and in which regions.

“We could create triggers so that if the deposits fall below a certain level, automated alerts will go out with reports attached to it showing what’s driving those numbers to do what they’re doing,” says Michael Benassi, the credit union’s vice president of enterprise analytics.

United, which has more than 194,000 members in seven states, uses Qlik Replicate to reproduce data from its core transaction system in near-real time, and Qlik Sense to perform the analysis, reporting and alerting, Benassi explains.

“Before this technology came along, the best we would be able to do is pull in what the data was yesterday, and not really what’s happening in real time,” Benassi says. “If you start to see a run on your deposits at an institution, that can happen in a day or two, and if you’re relying on nightly reporting, you’re not even going to know it hit you until the next day. This really gives peace of mind that we can jump in at any point and see what’s going on with our deposits.”

Click the banner to learn how advanced analytics provides deeper insights for financial institutions.


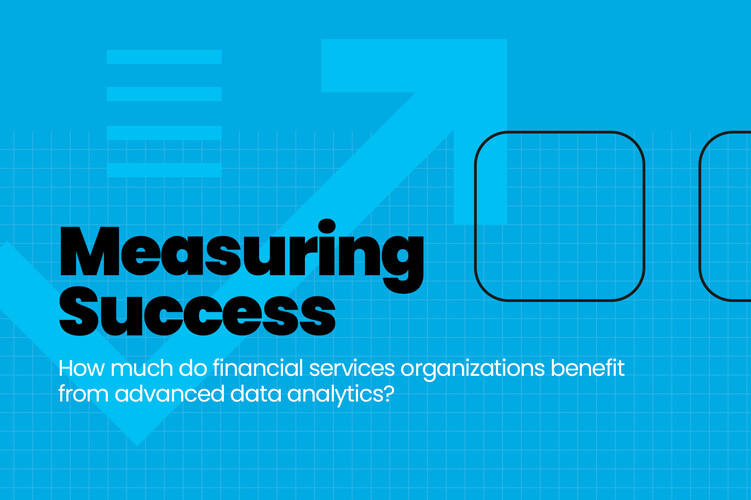
The Many Ways Financial Institutions Apply Analytics

Financial services institutions turn to advanced data analytics solutions to help them protect their customers against fraud, make smart investments and or evaluate loan applications, among many other use cases.

Platforms such as Google Cloud, Qlik and Tableau make sense of massive data sets and gain real-time insights into customer behavior, risk and operational performance, according to Indranil Bandyopadhyay, principal analyst at Forrester.

“These platforms allow institutions to create interactive dashboards, automate reporting and integrate structured and unstructured data for deeper analysis and faster, more accurate business decisions,” he says.

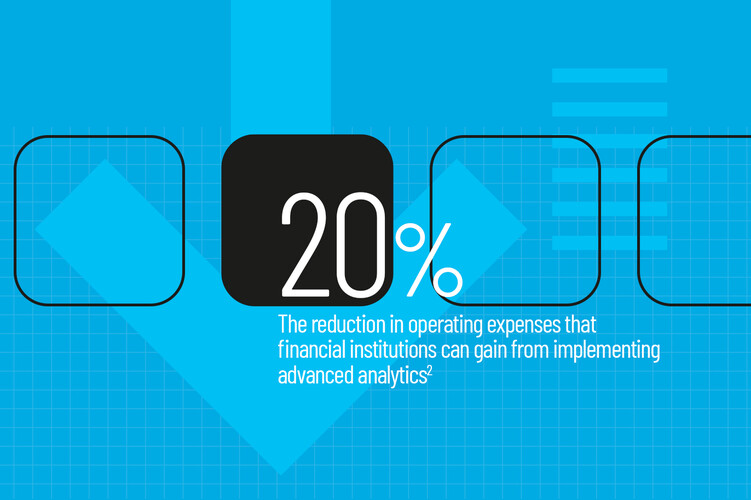
Advanced data analytics drive decision-making for financial institutions on credit approvals, policy underwriting, fraud detection and investment strategies, as well as payroll and resource allocation on the operations side, Bandyopadhyay explains. He adds that analytics-driven decisions can help institutions optimize lending, manage risk, streamline claims and boost efficiency.

RELATED: The financial solutions and services from CDW that can help your team.

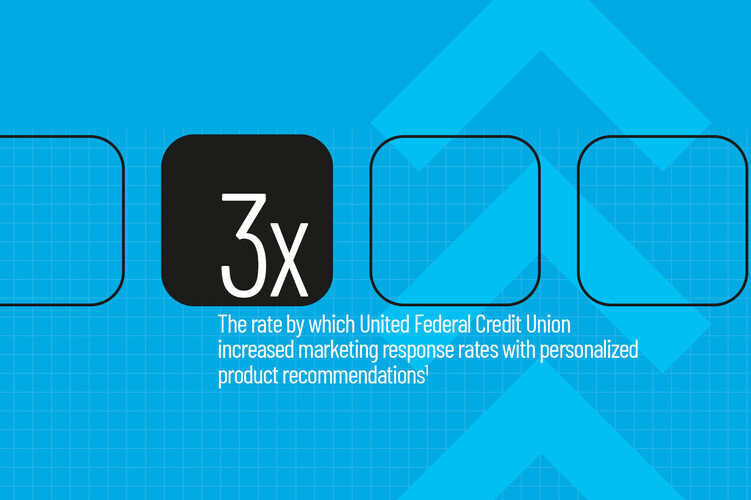
For United, a key feature is the membership overview dashboard, which provides more than 170 ways to filter members to create targeted lists. United can pull data from the dashboards and export it directly into its customer relationship management application after the digital marketing team examines it.

“My team focuses on getting that data out there into a format that’s easy to use, and then upskilling the business units on how to use those dashboards,” Benassi says.

The filters in Qlik allow United to track customer growth rates, see who may be at risk of soon canceling a membership, who should receive checking account promotions and more.

“Being able to see all of that in one place really allows you to dive deeper into answering your questions,” Benassi says.

Michael Benassi


How USAA Deploys Analytics

Now more than 100 years old, USAA delivers insurance and financial services, including banking, casualty insurance and investment products, to members of the military and their families. Analytics is at the heart of all of it.

“In running our business and forecasting our losses and our expenses, we are very heavily data analytics-driven,” says Ramnik Bajaj, senior vice president and chief data analytics officer at USAA

For example, it uses Tableau to inform decisions about rolling out new features in its mobile apps: If enough members click on a pop-up notification about paperless billing, for instance, USAA will expand it efforts. “Only if it is showing a very positive uptick in what we are trying to achieve will we roll it out to all 14 million of our members,” he says.  

EXPLORE: How financial services can develop an effective data protection strategy.

The company also examines telematics in its app to determine whether insured drivers qualify for discounts based on their driving behavior as part of the SafePilot program. If a customer’s driving behavior is satisfactory, the company offers a 20% discount on insurance.

“All of the discounts we offer are based on analytics, on your driving behavior, and that’s the core of the product,” Bajaj says. “If you score as a safe driver, we are able to lower your premium, because our analytics show that as a safe driver, the losses we incur for payouts on accidents will be that much lower.”

How Analytics Helps Improve Contact Center Operations

Analytics and dashboards help USAA forecast call volume to its contact center based on historical trends and weekly patterns.

“We do a lot of analytics to try and accurately forecast our call volume, and then we staff our call centers to have coverage at all times,” Bajaj says.

USAA can measure the success of its data analytics tools based on how long customers stay on hold waiting for a member services representative.

“If our forecasting is good, then our staffing will be adequate, and our hold times will be reasonable,” Bajaj says. “If our forecasting is incorrect, our staffing won’t be adequate, and our hold times will grow.”

Call center monitors use Tableau dashboards to monitor calls coming in and hold time. Tableau allows USAA to build out core analytics on customer calls and forecast staffing needs using quantitative and artificial intelligence (AI) models. Meanwhile, the company also uses Amazon SageMaker to train its machine learning models. It uses ML to calculate forecasted risk when underwriting properties.

USAA also uses data analytics to improve client relationships by personalizing offers on insurance and banking products. “We might predict that you’re in the market for a new car or a new home, or we might predict that you are about to retire, or that you’re about to change your job,” Bajaj says.

KEEP READING: How Formula One and Oracle Red Bull racing mined faster insights.

USAA also conducts predictive member satisfaction scores based on surveys with members after calls. AI models listen to calls and provide a score for the call.

Tableau dashboards provide management a view of member satisfaction feedback on team performance and overall business.

Moving forward, USAA will focus on making analytics and insights more real-time, according to Bajaj. The company also plans perform analytics on unstructured data such as call transcripts, documents and images.

“Now, with advanced generative AI techniques, it’s possible to do a lot of rich analytics on unstructured data,” Bajaj says. “The dashboards will always be there to give you hard data on how your performance is, while generative AI helps you automate things that previously only people could do, because it was all unstructured data.”

47%

The number of business leaders confident they can use data to drive action and decision-making

Source: salesforce.com, “Insight vs. Instinct? Under Increased Pressure, Leaders Grapple with Data Skepticism in Decision-Making,” April 15, 2025

Data Analytics Decisions During a Hurricane

In October 2024, Hurricane Helene rolled through North Carolina, and the United team was faced with decisions on how to help members affected by the storm. They turned to transaction histories and membership overviews on a Qlik dashboard to get a list of ZIP codes affected by the hurricane.

Within seconds, they had created a list of members potentially impacted by the disaster.

“From there, we were able to identify members that might be more in need of resources, then throw that list of members into our transaction dashboard to see how many of those members might be experiencing financial hardship, and waive some fees for a period of time,” Benassi says.

The dashboards cut down the time it takes for United’s team to verify parameters and make fee-reversal decisions to less than 10 minutes rather than a day or two, Benassi says.

DIG DEEPER: The importance of putting the customer first in data-based decisions.

“That makes those decisions a lot quicker, because you can see in a matter of seconds how many people might have been affected,” he says. “If we identify a list of fees that members were charged that we’d like to refund to help them through the situation, they can use those transaction dashboards and generate a file that gets posted directly onto the core to reverse those transactions.”

Going forward, United is exploring how advanced data analytics could enable auto-decisioning. Personalization will be a key focus when it comes to decision-making using advanced analytics, according to Benassi.

He says that using data analytics made it possible to triple the conversion rate for members by creating personalized recommendations.

“I think our next step will be leaning into those large language models and what we can do to create more personalization,” Benassi says.

Click the banner below to keep reading stories from our new publication, BizTech: Financial Services.

Photography by Bob Stefko
Close

See How Your Peers Are Leveling Up Their IT

Sign up for our financial services newsletter and get the latest insights and expert tips.