5 Free Tools for Managing and Supporting Windows
While online communities such as Microsoft’s Most Valuable Professionals (MVP, the Microsoft Developer Network (MSDN) and TechNet are great resources for finding answers to pressing issues, Microsoft also offers free do-it-yourself tools for troubleshooting and managing the Windows operating system.
Here are five of the best free tools available for Windows management.
1. Security Compliance Manager (SCM) 2.5
Part of Microsoft’s Solution Accelerators offering, SCM provides system administrators with all of the security best practices Microsoft issues in a single location, along with the ability to apply and manage security configuration. SCM comes with baseline Group Policy security settings for Microsoft products that have been tested in a wide range of customer scenarios, developed in collaboration with industry and government agencies, and are supported by Microsoft.
SCM also provides information about settings contained in the baseline policies, beyond what is usually found in Windows Server’s Group Policy Management Console (GPMC), explaining why the configuration has been set and its potential impact.
As a repository for knowledge and baseline settings, SCM doesn’t scan systems for compliance. However, you can use SCM to create System Center Configuration Manager (SCCM) Desired Configuration Manager (DCM) packs from your baseline Group Policy configurations and then scan for compliance.
SCM allows you to duplicate baseline policies so you can make your own modifications. One of the most important features of SCM is the ability to compare and merge baselines. For example, if you have a support issue and want to find out how a custom baseline differs from Microsoft’s, you can run a compare operation and list the differences. There’s also a merge function that lets you create a single baseline from multiple configurations.
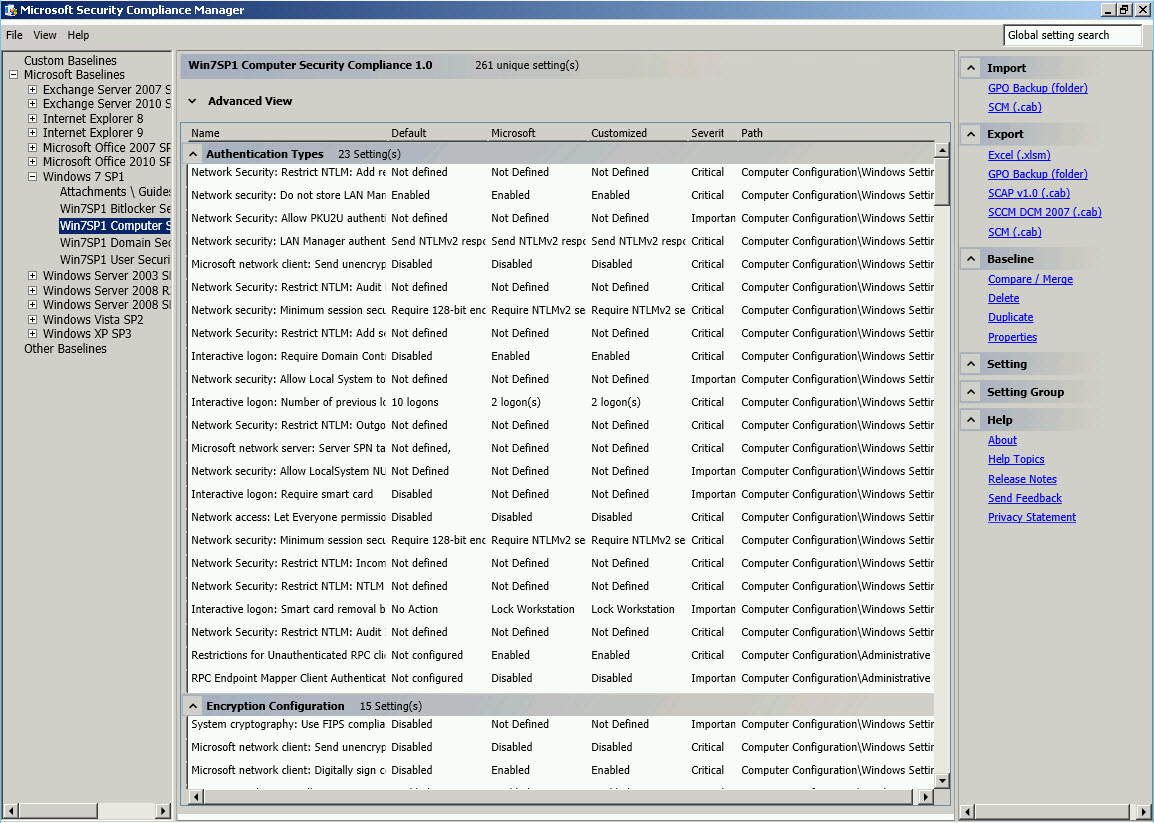
Figure 1 – A baseline configuration policy in SCM
Once you’ve got your baseline configured, there are a number of export options but the most useful is to export the settings as a Group Policy backup, allowing you to create a new Group Policy Object (GPO) in Active Directory. You can also do the reverse and import a GPO backup into SCM. You can also export to Excel or to SCM’s own .cab format. SCM version 3.0 is currently in beta and adds support for Windows 8 and Server 2012.
2. Attack Surface Scanner 1.0
Intended primarily to help software developers understand how their software affects the attack surface — the parts of the software available to all users and often without authentication — of a device, Attack Surface Scanner can also be used by system administrators and auditors to understand the attack surface on computers in their environment. The tool analyzes new or changed files, registry entries, Active X Controls, Windows services and other configuration settings that can impact security.
The tool, which takes multiple snapshots of a system when software is installed, can run using a wizard or automated from the command line and is currently supported on Windows 7 or Windows Server 2008 R2 with the Microsoft .NET Framework 3.5 Service Pack 1.
The Attack Surface Scanner is easy to run; you just need to specify where to store the resulting .cab files. Once a .cab has been generated, you can run the tool again and use it to generate an attack surface report, which is a comparison of two .cab files, one generated before a change was made to a system and the second after.
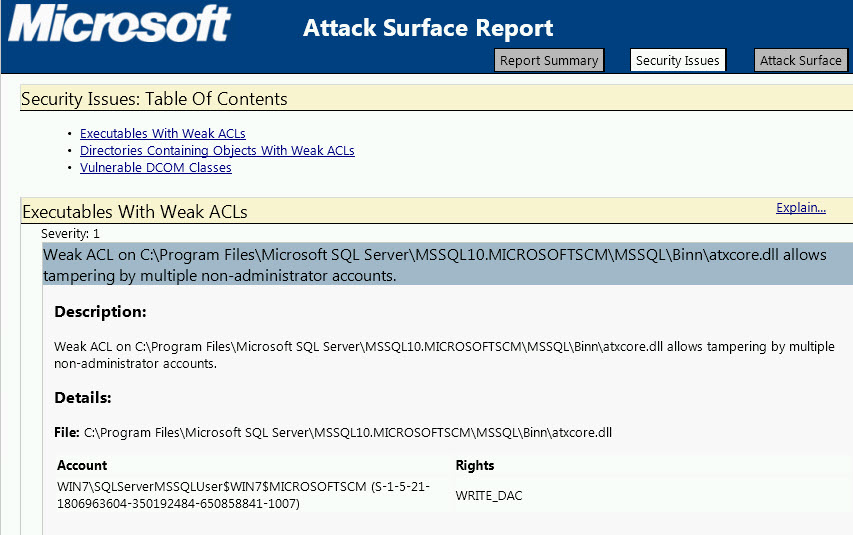
Figure 2 – An attack surface report
3. Disk2VHD
Disk2VHD is a Sysinternals tool found on TechNet that has also found its way into System Center Virtual Machine Manager. Despite its mere 121kb size, Disk2VHD is an excellent solution for converting the data on physical hard drives into fully working virtual drives for use with Hyper-V in the .VHD format. While Disk2VHD doesn’t currently support converting to the new .VHDX format used by Hyper-V 2012, you can convert .VHD files to .VDHX using Hyper-V Manager in Windows 8 or Server 2012.
Run Disk2VHD on the system where the physical disk you want to convert is attached. Select the volume to convert under Volumes to Include and click Create. You can see in Figure 3 that it’s possible to change the output directory for the new virtual hard disk.
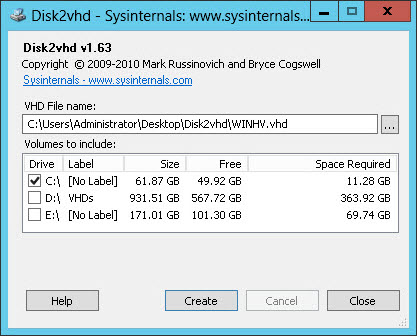
Figure 3 – Converting a physical volume to a virtual hard disk with Disk2VHD
4. Process Explorer
Another Sysinternals tool, Process Explorer provides an alternative to Task Manager. While Task Manager in Windows 8 and Server 2012 has improved vastly, Process Explorer is more advanced and an essential troubleshooting tool for Windows 7 and earlier versions.
Like all Sysinternals tools, Process Explorer is a portable application that doesn’t need to be installed. The main view is similar to Task Manager, but you can choose which columns you want displayed, which gives you information on processor, memory, disk I/O performance, etc.
Process Explorer gives more accurate readings of CPU usage than pre-Windows 8 Task Manager, and the lower pane can be switched to give information on process DLLs or handles, making Process Explorer especially useful for troubleshooting handle leaks or DLL versioning issues. There’s also a graphical user interface for general system information, such as CPU and disk usage.
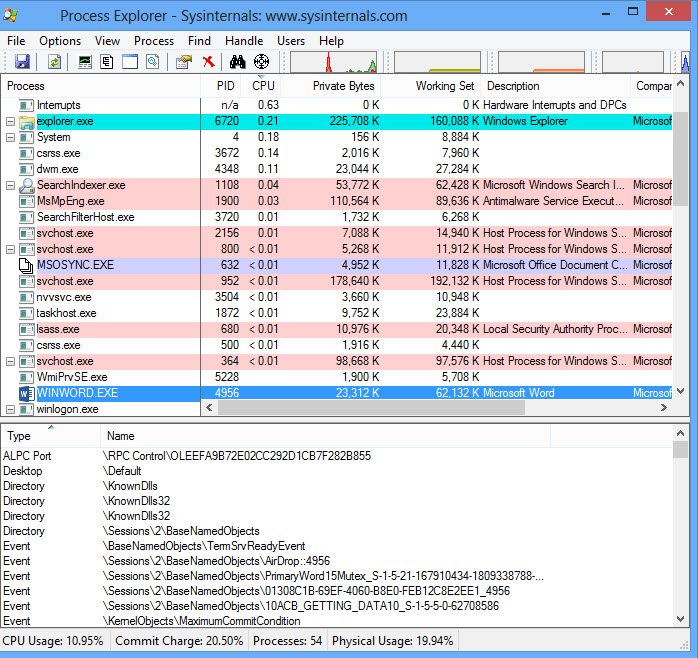
Figure 4 – Process Explorer in action
5. Joulemeter
Microsoft Research’s Joulemeter is designed to help troubleshoot power problems commonly found on notebooks with batteries that are draining faster than expected but can also be used on desktops and servers. The tool requires the .NET Framework 3.5 or later and currently only supports devices running Windows 7 and Server 2008 R2.
Once Joulemeter is installed, you have to calibrate it by disconnecting the notebook from its power source for around 15 minutes. There’s also an option for manual calibration. After calibration, Joulemeter automatically switches to the Power Usage tab to show component power usage in watts. Optionally, you can specify a running application to see its CPU power usage. The base measurement indicates the power consumption when the notebook is turned on but idle, for instance, when there’s no application and process activity.
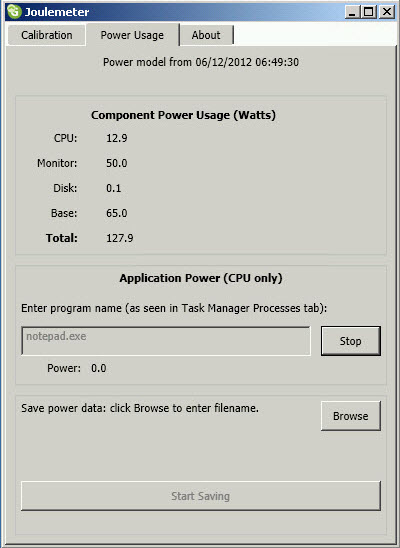
Figure 5 – Notebook power consumption in Joulemeter
