Visualization Can Help Businesses Tame the Big Data Jungle
Data is a living, breathing thing, but far too often, we treat like it something stagnant or frozen in time. The shift to digitized business processes and models is quickly changing that viewpoint, though, as more users and companies demand constant access to real-time data.
CDW Technical Architect Hardeep Singh points out in a recent post on the CDW Blog that most businesses are tethered to outdated concept of data gathering.
For many routine business scenarios, [Microsoft] Excel is the tool used to convert flat tables into pivot tables and charts in order to make sense out of the data and help make some business decisions. But by the time it reaches your target audience, it is outdated most of the time.
Getting the data into a readable format is one thing. The more important part is delivering it to your target audience in timely manner and viewable on their choice of platform (PC, tablet or smartphone).
To get to this point where data is accessible in real time and in formats that make it mobile- and desktop-friendly, companies need to start understanding how to translate their datasets beyond Excel.
That means getting comfortable with JSON, Web APIs and OData services, Singh says. Once the data is in this format, it can then be fed into native mobile, web or hybrid apps.
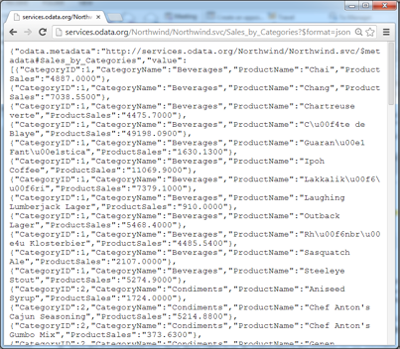
Singh crystallizes this by showing how raw data looks in the JSON format:

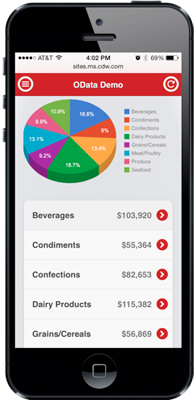
And how it could appear in a much more user-friendly format in a mobile app:

This shows the importance and power that presentation has in making Big Data projects valuable to line of business executives. It’s hard to get them excited about an unstyled, uninspired list of data, but give them a mobile app that makes their work easier or gives them insights they didn’t have access to before, and suddenly the value of that data becomes clear.
In a 2010 TED Talk, data journalist and information designer David McCandless spoke about how important visualization is when it comes to translating the value of data.
“There's something almost quite magical about visual information. It's effortless, it literally pours in. And if you're navigating a dense information jungle, coming across a beautiful graphic or a lovely data visualization, it's a relief, it's like coming across a clearing in the jungle,” he said.
Mobile apps with visualization, in this instance, can be the equivalent of a machete that businesses can use to clear the untamed Big Data forest.


